
Since 2019 marked the end of a decade (for most of which I had been keeping track of my books), I wanted to take a look to what these data could tell me, in particular with regard to changes. In 2010 I was still in high school and now I am nearing the end of my PhD, I joined Netgalley in 2014 and got my first Kobo eReader that year. Since 2015 I have been making regular trips to London bookstores where the choice of English books is far superior to what I get at home. How do these and others reflect on my books?
I wanted to find out. So, I collected all books I’d read/added during the period (I have been on GoodReads since 2011 and having been keeping track meticulously over there) and exported everything into Excel. And that – as they say – is where the magic happened. I looked at some useful or maybe less useful stats to make sense of 10 years of bookish life.
Books and Pages
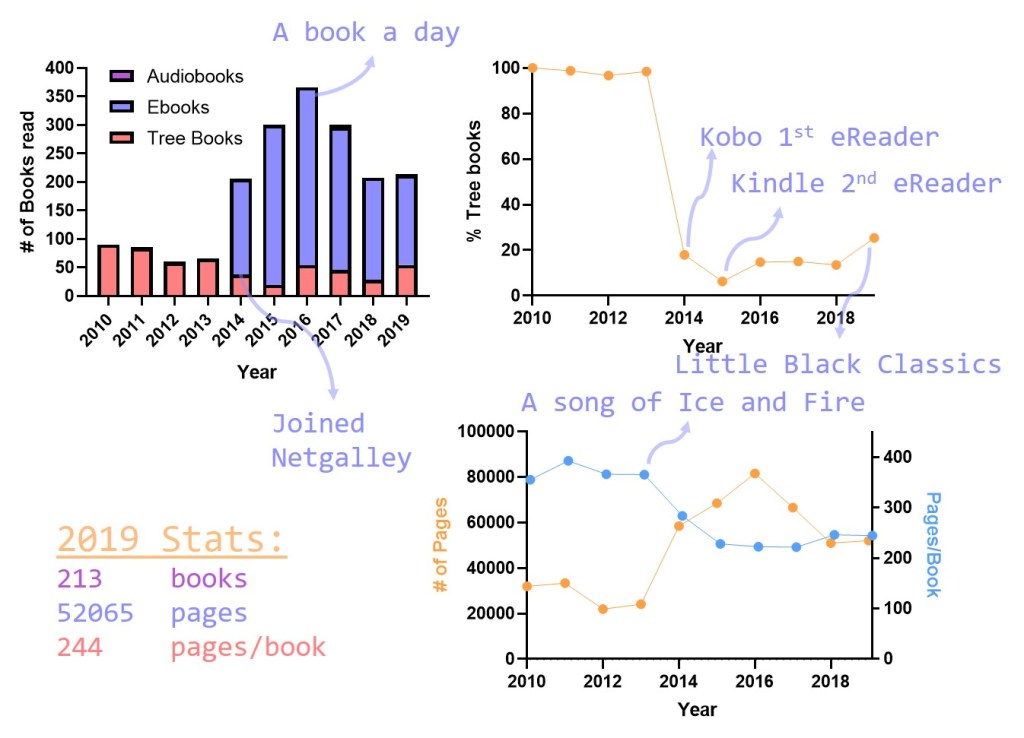
Here I looked at how many books I read, and in what format. The overall increase in books and particularly ebooks is clear, and this since I joined Netgalley and got my first eReader. I also plotted which percentage of books are Tree books, and after an all time low in 2015 this number has been on the rise again. The number of pages follows the overall book trend (in 2016 – my top year I read 366 books for a total of >80.000 pages), but when looking at the number of pages per book, there is a drop which is probably caused by a combination of reading a) ebook only short stories in the series I’m following and b) ebooks being less strictly bound to the idea that a book should be between 300-400 pages, preferably.
Reading across the months
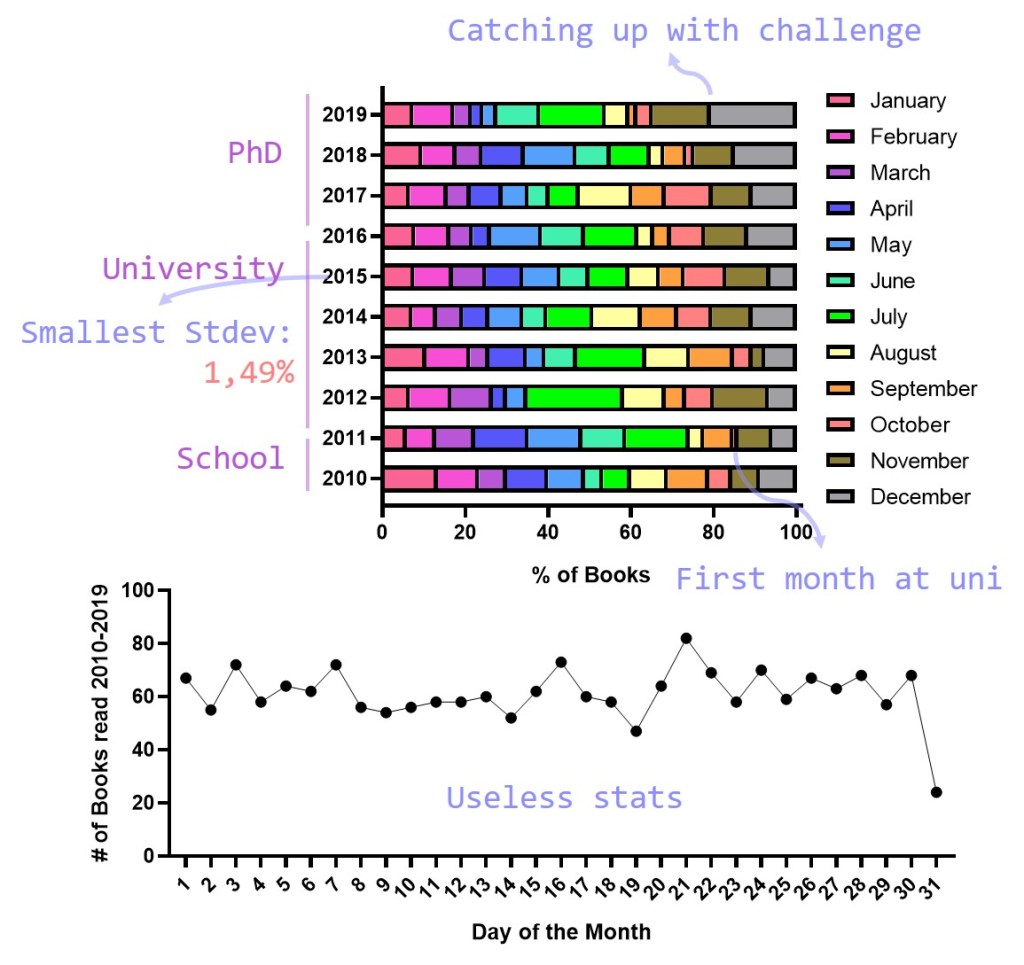
Next, I took a closer look at each year, so that I could see when all the books were read, dividing everything per month and plotting the relative amount of books for each period. Surprisingly – or maybe not, the month I read the absolute minimum in the last decade was October 2011 aka my very first month at university (I remember I was reading a book by Karin Slaughter at the time concerning murders on a college campus which was not ideal as I had just moved onto the university campus myself). Patterns vary a little from year to year, but still I would like to point out there are seemingly to small reading slumps a year; one around March and another around September. I haven’t been able to find a real explanation for that one, to be honest. 2015 was the year when my reading was spread most nicely over the entire year, resulting in a rather low standard deviation (a statistical measure to determine how much variation there is in a sample – lower values means less variation).
While I was at it, I also calculated some random stats which are quite useless but fun either way. There is no real effect of the day of the month on when I finish books (I though maybe there would have been a sprint near the end of the month – but no), except there are fewer books for the 31st, which occurs less often.
And some more stats
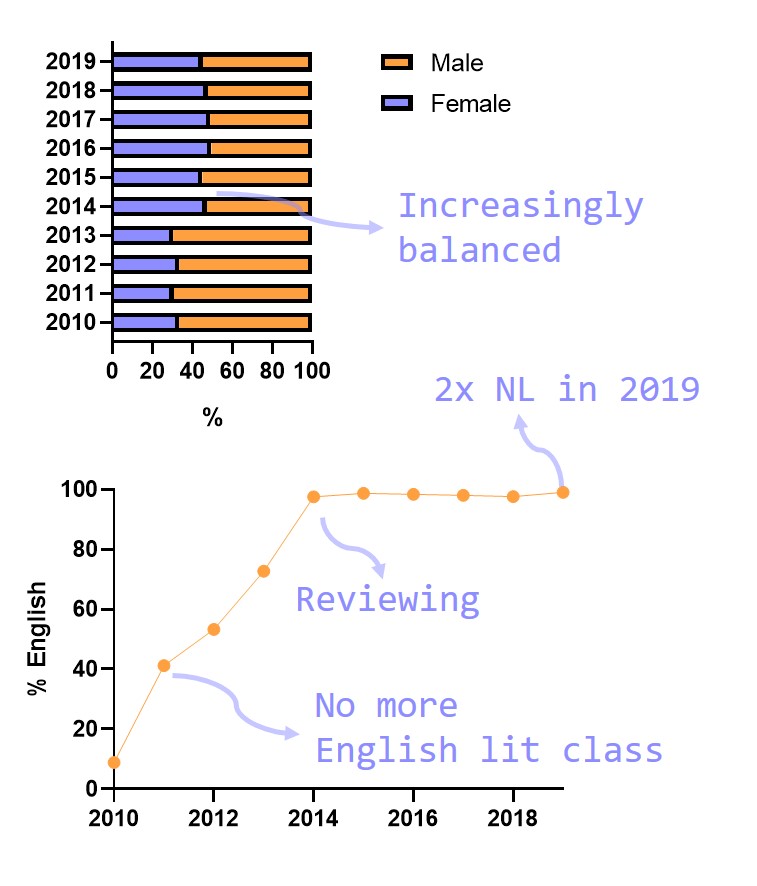
I also looked at gender balance, which currently stands around 50%. However, I was actually quite surprised to find that it was so unbalanced in the beginning of the decade (I had not expected this – one of the fun things of collecting data).
I also looked at the language. I know that lately I have been reading almost exclusively in English, but when did it change? Apparently, as soon as I was finished with English literature classes, and I was no longer required to read English books *sigh*. So, some surprise that I already read +/-50% of my books in English even before I started reviewing. After eReaders and Netgalley, I seldom read Dutch books any more.
Tackling Mt. TBR – the ROOT project
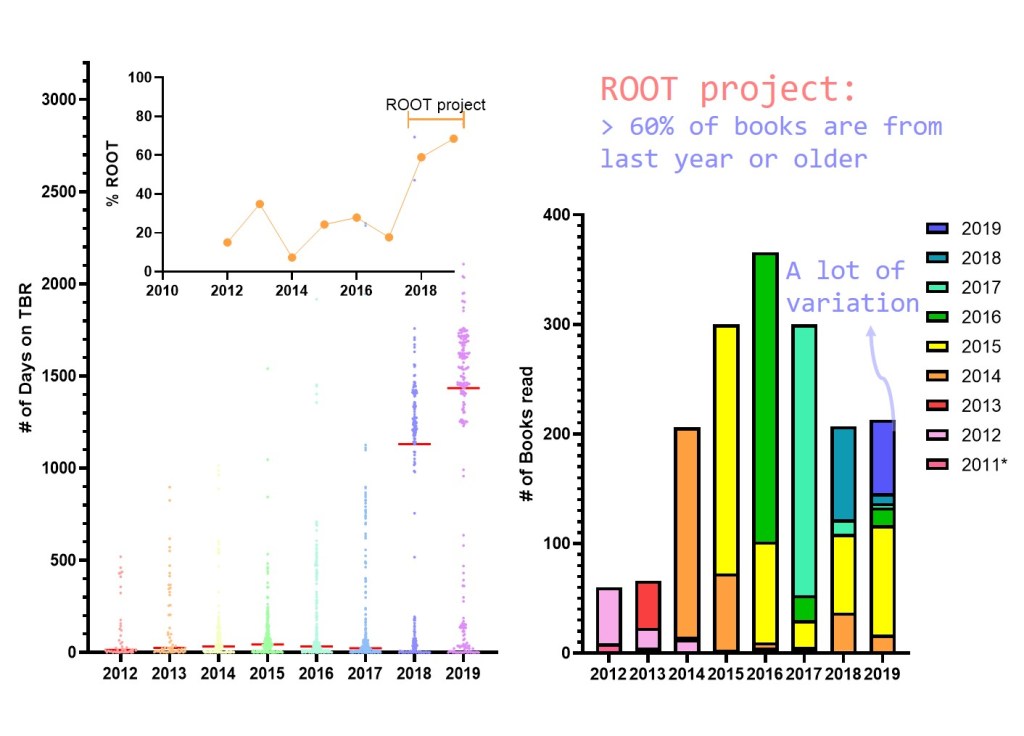
I have increasingly become aware that there was a problem and it was called my TBR. New books kept arriving at a faster pace than even I could read them. So, starting in 2018 I put in an effort to pick up these older books, so called ROOTs (short for Read Our Own Tomes; originally from LibraryThing), and clear them from my shelves. As you can appreciate, percentages have gone up quite drastically. This becomes even more clear when looking at the number of days a book spend on the TBR before it was read in a certain year. This used to be quite low – new books scream loudest and get picked up soonest; but since the start of the project this number has also gone up.
Finally, I looked at what year the books were added to the TBR, and 2019 marked the first year where books from its own year were not the biggest fraction. Even more so, before the start of the project the own year was the majority share of all books read.
So there you have it, 10 years of reading analyzed and summarized in a number of graphs. Onto the next 10 years!
